Add Row
Add Element
cropper
update
AIbizz.ai
update
Add Element
  • Home
  • Categories
    • AI Trends
    • Technology Analysis
    • Business Impact
    • Innovation Strategies
    • Investment Insights
    • AI Marketing
    • AI Software
    • AI Reviews
June 23.2025
3 Minutes Read

Unlocking the Power of Moment-Ratio Diagrams for AI Learning Paths

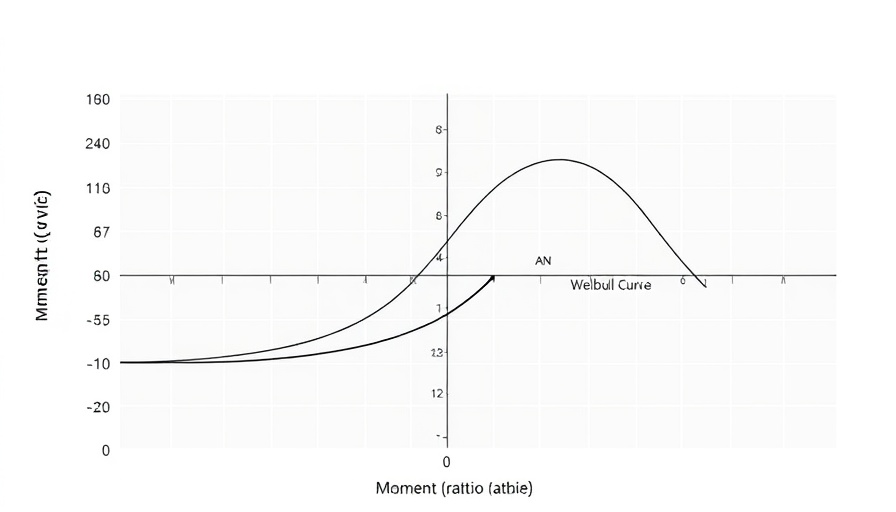
AI learning: Moment-ratio diagram with Weibull curve illustrating skewness and kurtosis.

Understanding Moment-Ratio Diagrams in AI

Moment-ratio diagrams are crucial tools in statistical modeling, especially when it comes to univariate distributions. They provide insights that can significantly impact how data scientists and AI researchers approach data modeling tasks. In this article, we will explore how to enhance a moment-ratio diagram by adding a curve for specific probability distributions, particularly the Weibull distribution.

What is a Moment-Ratio Diagram?

A moment-ratio diagram visually represents the relationship between skewness and kurtosis of various distributions. This can help data analysts and machine learning practitioners quickly determine the appropriate statistical distribution for their data sets. For instance, one can plot sample skewness and kurtosis to compare their calculations with common distributions, such as normal or exponential distributions. Accessing this visual framework allows for quicker and more informed decision-making in data modeling.

Enhancing the Diagram: Adding Curves

The ability to add curves for distributions not represented in the original diagram opens new avenues for statistical analysis. For example, many researchers use the Weibull distribution when dealing with reliability data or failure rates. By incorporating the Weibull curve into the moment-ratio diagram, users can visualize how this distribution behaves in terms of skewness and kurtosis. The process for adding this curve involves manipulating an annotation dataset within SAS, which streamlines the diagram's functionality.

A Step-by-Step Approach to Modify the M-R Diagram

To add curves to the moment-ratio diagram, you will need to download and run a specific SAS program. This program creates an annotation dataset named "Anno," which captures the required skewness-kurtosis relationships. Once the dataset is generated, you can call a macro to overlay additional points on the diagram using the sample data.

The key command looks like this:

%PlotMRDiagram(DS, Anno, Transparency=0)

This command overlays the sample’s skewness and kurtosis values, enabling a clear comparison with the additional curves. For deeper analysis, you can adjust the transparency to highlight a more comprehensive view of how well each distribution fits your data.

Why Data Scientists Should Utilize Moment-Ratio Diagrams

As AI learning and technologies evolve, tools like the moment-ratio diagram become invaluable for practitioners in data science. Not only do these diagrams help visualize complex statistical relationships, but they also enable analysts to make data-driven decisions more efficiently. By plotting actual data within these diagrams, users can better determine suitable models for their data and improve their predictive accuracy.

Further Learning: AI Science Insights

To fully leverage statistical tools in AI learning paths, researchers are encouraged to dive deeper into statistical programming and data visualization techniques. Tools like SAS demonstrate profound capabilities in creating visually impactful and informative diagrams for data analysis, meeting the evolving demands of AI science.

Practical Insights for Future Applications

Looking ahead, incorporating advanced statistical tools such as moment-ratio diagrams in AI learning platforms can foster a deeper understanding of data distributions. As AI continues to reshape industries, mastering these tools will enable better forecasting and data-driven strategy formulation.

By understanding how to accurately represent data, AI practitioners can enhance the robustness and efficacy of their models, particularly in applications involving predictive analytics and machine learning algorithms.

Technology Analysis

1 Views

0 Comments

Write A Comment

*
*
Related Posts All Posts
08.15.2025

Unlocking the Future of Motor Insurance with Automated Claims Assessment

Update Revolutionizing Motor Insurance: The Future of Automated Claims AssessmentImagine getting into a car accident and knowing that your insurance claim will be processed instantly, without the usual weeks of waiting. As mundane as it sounds, this vision is edging closer to reality as technology transforms the motor insurance sector. Automated claims assessment—powered by artificial intelligence (AI) and smart data management—is set to redefine the landscape, benefiting both customers and insurers alike.The Growing Need for Speed in Claims ProcessingThe global motor insurance market is already enormous, expected to hit USD 973.33 billion by 2025, with projections indicating it could balloon to approximately USD 1,796.61 billion by 2034. The demand for efficiency in claims processing is peaking, as insurers grapple with costs linked to fraud, human error, and lengthy processes. These challenges have stifled profitability and customer satisfaction.How AI Is Changing the GameThe current model of claims assessment is predominantly manual, involving human assessors who must visit accident sites and inspect vehicles. This traditional method not only demands substantial time and human power, but it is also vulnerable to errors and inconsistent judgments. In stark contrast, an automated approach employs AI learning to streamline the assessment process. By utilizing software that integrates advanced analytics, insurers can refine their operations while delivering a faster and more reliable service to customers.Benefits of an Automated Claims Assessment ModelAutomation simplifies each step of claims processing. For example, SAS Viya Workbench allows users to upload accident images, forecast damage types, and instantly access the necessary policy details. This cohesive system harnesses machine learning to train claims models efficiently, significantly reducing overhead costs and processing delays. The result? Quicker payouts and improved customer satisfaction.The Future of Motor Insurance: Predictions and TrendsAs we step into a new era of motor insurance, the implications of automated claims assessment extend beyond just speed. A seamless interplay of data management and user experience can set a new benchmark in the industry. Insurers adopting such technologies not only enhance their operational efficiencies but position themselves as innovators who prioritize customer service.Conclusion: Embracing the FutureIt’s evident that the integration of AI and automated models into motor insurance claims assessment is no longer a luxury but a necessity. As the industry evolves, understanding and leveraging these advancements will become critical for all stakeholders involved—from insurers to policyholders. The emphasis should remain on improving operational efficiency and customer satisfaction in step with industry demands.For those eager to explore how AI learning can further elevate your understanding of this revolutionary transformation, there are ample resources available. Staying informed on these trends can make a real difference in how we perceive and use insurance in our lives.

08.14.2025

Unlock the Power of AI Learning: Five Days of Data Insights

Update The Essential Role of Fiber in AI Learning Fiber may not be the first thing that comes to mind when discussing artificial intelligence, but much like fiber plays a critical role in our nutritional health, it's essential to understand the metaphorical 'fiber' that supports AI learning and innovation. This article will explore how understanding the nuances of fiber can help enhance how we think about AI learning paths, and the implications it has on business and technology. Connecting Fiber to AI: The Importance of a Balanced Approach Much like we require a balanced intake of fiber to maintain our health, cultivating a balanced approach to AI learning is vital. AI technologies thrive on comprehensive datasets, which serve as the input for machine learning models. The 'fiber' in this case can be thought of as the diverse and plentiful data in various forms, such as text, images, and structured data that inform and enhance the algorithms. Just as a varied diet contributes to digestive health, a varied dataset fosters robust AI systems that yield accurate and comprehensive results. Five Days of AI Learning: A Structured Approach To make the concept of integrating AI learning accessible, let’s outline a simplified analogy using the five days of fiber meal planning. Each day represents different sources of data and understanding: **Day 1 – Textual Data:** Start with textual data inputs such as blogs, articles, and user-generated content. Just like incorporating whole grains, textual inputs enhance the richness of AI learning. **Day 2 – Video Content:** Use video tutorials and educational videos similar to introducing fruits into your meal plan. They provide dynamic and engaging content for the AI training process. **Day 3 – Structured Data:** Integrate structured datasets from public databases, much like legumes’ beneficial nutrients. Structured data forms a strong base for machine learning algorithms. **Day 4 – User Feedback:** Gather user feedback to refine systems, akin to adding spices for flavor. User insights help make AI interactions more relevant and effective. **Day 5 – Experimentation and Learning:** Engage with new methodologies through testing AI systems, just as one would diversify with colorful salads. This encourages innovation in AI processes. Choosing Quality Over Quantity: Digestive Challenges of Data When digesting fiber, it’s crucial to increase intake gradually, depending on individual tolerance. In the same vein, when an organization implements AI systems, it's important to understand the organization's capacity for adapting to new data inputs. A common pitfall many companies face is trying to push too much data too quickly, which can overwhelm the systems much like dietary fiber can overwhelm the digestive system without proper hydration. Increased data influx can lead to poor performance of AI systems, resulting in bloating—inaccurate outputs or faulty learning. The Future of Fiber and AI Learning: Trends and Innovations As AI continues to evolve, we’ll likely see a stronger convergence of diverse data inputs and learning methodologies that mirror the growing emphasis on fiber in our diets. Emerging technologies in AI science, such as advanced machine learning capabilities and natural language processing, demand quality data akin to the digestive needs for fiber. Trends indicate a collaborative approach to AI learning which encompasses feedback loops and iterative learning processes—transforming the way industries leverage AI for decision making. Final Thoughts: What You Gain by Understanding Fiber's Role in AI Just as fiber supports digestive health, a deep understanding of how to harness various data types enriches AI learning paths. Grasping the importance of a balanced data diet can yield high-performing AI solutions that translate into business success and innovation. As you reflect on your journey in AI and fiber, consider tracking your learning and implementation process much like one would track fiber intake—this ensures steady growth and adaptation in this ever-evolving landscape. In conclusion, whether you're interested in improving your health through fiber or enhancing your organization’s technological capabilities through structured AI learning, understanding the interconnectedness of these elements fosters growth in both personal and organizational domains.

08.13.2025

Bridging the Gap in Analytics Leadership: Embracing AI Learning and Expertise

Update Nurturing a Data-Driven Culture in Leadership In today's rapidly evolving technological landscape, organizations are increasingly leveraging analytics to drive decision-making. However, as Jack Phillips, CEO of the International Institute for Analytics (IIA), points out, the core challenge in analytics is not merely technical—it's fundamentally human. As businesses strive to make data-driven choices, nurturing a culture that embraces analytics at all levels becomes paramount. The Shift from Supply to Demand in Analytics Phillips highlights a notable change in how organizations view analytics. The traditional mindset focused on the supply side—concentrating on data procurement, quality control, and software deployment. In contrast, modern organizations are pivoting towards a demand-driven approach. This new perspective emphasizes collaboration with stakeholders across all business units, pushing them to adopt data-driven thinking that affects strategy and operations. Such a shift signifies that merely acquiring technical capabilities is insufficient; embedding a data-centric culture is essential for sustained success. Redefining Leadership: Big L vs. small L One of the more intriguing concepts presented by Phillips is the distinction between Big L and small L leadership. Big L leaders are the high-ranking officials, such as Chief Analytics Officers or Chief Data Officers, but Phillips stresses the importance of small L leaders—those managers and domain experts who function on the ground, advocating for analytics in their respective areas. This democratization of analytics leadership allows for a broader understanding of how data can influence everyday decisions within various functions like marketing, HR, and supply chain management. Customizing Training for Effective Analytics Adoption Even with strong leadership, the challenge of transforming an organization’s approach to analytics often lies in training. Phillips notes that effective training programs must address the specific needs and contexts of different industries. Customization is key; whether in healthcare or finance, industry-specific use cases make learning relevant and actionable. The IIA's DELTA Plus model, which forms part of the SAS Analytics Leadership Program, emphasizes not only technical knowledge but also the importance of organizational readiness and change management skills. This tailored approach ensures that learning resonates with participants and translates into tangible business outcomes. The Reality of AI in Business As the AI hype cycle captures media attention, Phillips urges caution regarding its role in guiding analytics strategy. While artificial intelligence is undoubtedly transformative, it must rest on a solid foundation of basic data analytics. Many organizations hastily seek out Chief AI Officers while overlooking the fundamental issues such as data quality that need addressing first. Phillips warns that as excitement builds around AI, businesses can lose focus on the foundational analytics processes that precede it, thereby diminishing the practical benefits of adopting these advanced technologies. Looking Ahead: Analytics’ Evolving Role in Business Understanding the future trajectory of analytics leadership is vital as organizations consider investments in AI and data initiatives. Phillips emphasizes the need for adaptive, resilient leaders who can navigate the complexities of this landscape. By fostering a culture that appreciates analytics at all levels and ensuring that education initiatives are tailored to context, enterprises can better prepare themselves for the evolving demands of data-driven decision making. As we navigate this landscape, the role of analytics leaders will continue to evolve. It’s crucial for organizations to embrace and champion a culture of data-driven leadership, where insights lead to informed decisions across various business functions. When everyone becomes a small L leader, the collective intelligence of an organization can flourish, leading to innovative solutions and a competitive edge.

Terms of Service

Privacy Policy

Core Modal Title

Sorry, no results found

You Might Find These Articles Interesting

T
Please Check Your Email
We Will Be Following Up Shortly
*
*
*