Add Row
Add Element
cropper
update
AIbizz.ai
update
Add Element
  • Home
  • Categories
    • AI Trends
    • Technology Analysis
    • Business Impact
    • Innovation Strategies
    • Investment Insights
    • AI Marketing
    • AI Software
    • AI Reviews
October 13.2025
3 Minutes Read

SAS Championship's 25th Anniversary: A Fusion of AI Learning and Golf

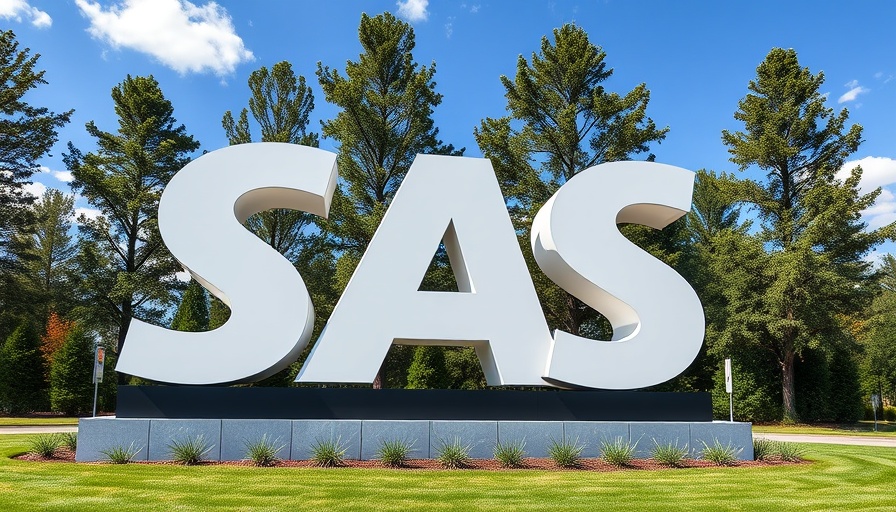
SAS logo sculpture in outdoor setting, AI learning path.

Celebrating a Milestone: The 25th SAS Championship

The 25th SAS Championship serves not only as a platform for elite golfers but as a powerful showcase of community and technology. While the greens echoed with cheers of accomplished athletes, the true highlight was a week filled with events that connected innovation with opportunity almost seamlessly. This year, the HBCU Invitational and career day provided a unique opportunity for student-athletes from Historically Black Colleges and Universities to network and learn about future careers in technology.

The HBCU Invitational: Bridging Golf and Technology

This year marked the fourth annual HBCU Invitational where young minds gathered to compete, interact, and explore their future. Reggie Townsend, Vice President of SAS, ignited the event by emphasizing the importance of curiosity and connection among students. He encouraged attendees to leverage this unique chance to create lasting relationships beyond the course.

With insights from leaders at LinkedIn and Microsoft, attendees delved into crafting a robust digital presence and preparing for future careers influenced by artificial intelligence. The tournament concluded with North Carolina A&T securing wins in various categories, showcasing the prowess of these young athletes.

Honoring Service: Folds of Honor Collaboration

In a heartfelt tribute, the SAS Championship extended its reach beyond sports to honor veterans through its partnership with Folds of Honor. A ceremonial opening, featuring JROTC from Cary High School and veterans sharing personal stories, conveyed powerful messages of remembrance and service. Pat Gallagher from SAS shared a poignant moment being 'coined'—a symbol of recognition and gratitude, highlighting how the championship aligns values of honor and education through awarded scholarships for families of wounded or fallen heroes.

Community Engagement: Fairway to Fun

Aiming to enhance community ties, the Fairway to Fun event delighted attendees with hands-on tech experiences and local cuisine. This wasn't just a festive gathering, but a celebration of creativity and connection with a mission. The YMCA of the Triangle partnered with SAS to promote STEM education, engaging youth in inspiring activities linking technology and personal growth. Events like these emphasize how the SAS Championship doubles as a significant community outreach and development platform.

The Final Competition: Alex Čejka's Remarkable Victory

On the greens, Alex Čejka clinched the title, making history as only the second German golfer to win the SAS Championship. His exceptional performance, scoring 9 under par, was marked not just by athletic prowess but also by the challenging rainy conditions that added an intriguing twist to the final day of competition. Čejka embodies the spirit of perseverance, resonating deeply with current and future generations of both golfers and tech professionals alike.

What's Next: Future Predictions in Golf and Tech

As technology continues to evolve, the intersections with sports like golf offer exciting prospects. The influence of AI is growing—tracking performance, enhancing training, and refining gameplay strategies, reshaping how athletes prepare and compete. This transformation isn't limited to golf; it's a glimpse into a future where AI learning paths are essential for both budding athletes and young professionals.

Such amalgamations highlight the necessity for technology and education initiatives in today’s STEM conversations. Organizations like SAS, by supporting events like the HBCU Invitational, are paving the way for the next generation of diverse technology leaders who will drive innovation forward.

Conclusion: Embracing the Future of Technology

The SAS Championship is much more than a prestigious golf tournament; it’s a community-building endeavor that integrates education, technology, and philanthropy. As the next chapter unfolds, there's an urgent call for continued support for STEM education, creating pathways for youth that embrace the advancing technologies shaping our future.

In light of this vibrant future, continue to engage with opportunities that bridge traditional practices with revolutionary technology. Seek out educational workshops, stay informed about industry developments, and above all, foster connections that propel both your career and community forward.

Technology Analysis

0 Views

0 Comments

Write A Comment

*
*
Related Posts All Posts
10.14.2025

Transform Your SAS Visualization: Using High-Low Plots as Histogram Emulators

Update Understanding High-Low Plots as Histogram Emulators in SAS When it comes to data visualization in SAS, the application of graphic tools significantly affects the way data is understood and presented. Among various methods, utilizing high-low plots to emulate histograms is garnering increasing attention. This technique not only provides a solution to the limitation of combining incompatible plot types but also offers a dynamic way to visualize empirical distribution alongside density estimates. Enhancing Data Visualization Techniques SAS, a powerful analytics tool, offers a variety of procedures such as PROC UNIVARIATE for histogram generation and density estimation, yet it presents challenges when plotting complex overlays. High-low plots come into play by allowing the overlay of one or more curves on a histographic display effectively. This integration provides an avenue for clearer comparisons between empirical data distributions and respective theoretical models. Why Choose High-Low Plots to Emulate Histograms? The beauty of high-low plots lies in their flexibility. Traditional histograms often face challenges when attempting to overlay data such as multiple density curves. As noted in the referenced discussions, standard histograms and series plots, which display line charts, are not compatible in PROC SGPLOT. The high-low plot, on the other hand, can seamlessly integrate the visual display into one cohesive graphics window, effectively allowing multiple curves to be showcased over the histogram-like data. Step-by-Step: Creating a High-Low Emulated Histogram To create a high-low plot in SAS that acts as an emulator for a histogram, you can follow a systematic approach. Begin by preparing the necessary data that includes the mid-points of the bins and their respective heights using PROC UNIVARIATE with an OUTHIST option. This provides the required structure for the HIGHLOW statement: data YourDataSet; /* Create your dataset */ input Centroid Low High; datalines; ... ; This dataset will serve as the backbone for the high-low plot, enabling you to represent your data effectively. Advantages of Using High-Low Plots By adopting high-low plots in data analysis, users gain significant advantages: Clarity of Representation: High-low plots can concisely represent variability within the data while showcasing overlays, thus enhancing communicative power. Customize Your Data Display: Integrating multiple display options allows users to tailor their plots according to the needs of their analysis. Facilitates Comparison: With high-low plots, comparing empirical distributions and fitted curves becomes considerably easier and more visually appealing. Future Trends and Practical Insights As data visualization continues to evolve, the need for adaptive and flexible tools becomes more pronounced. Emulating histograms with high-low plots not only caters to current analytical demands but is also aligned with emerging trends in data science, where visual clarity is essential for effective decision-making. Equipped with new insights into these powerful visualization techniques, professionals and learners can refine their approaches to data analysis, fostering a deeper understanding of underlying patterns through effective representation. Conclusion In conclusion, using high-low plots to emulate histograms in SAS represents a valuable skill for data analysts. By mastering this technique, users can enhance their analytical capabilities in areas such as AI learning, leveraging data effectively to inform decisions and drive innovations in AI science. So why not start implementing these strategies in your next statistical analysis project?

10.10.2025

Why Dehumanizing AI Is Essential to Understanding Human Potential

Update The Dark Side of Metaphors in AI Metaphors have long been a powerful tool for communication, allowing us to understand complex concepts by relating them to familiar experiences. However, when applied to artificial intelligence, they can lead to significant misunderstandings. As Evan Markfield suggests, when we say that "ChatGPT thinks" or "AI can empathize," we risk breathing life into something that is fundamentally a complex algorithm—a next-word-prediction engine. This misrepresentation can skew our understanding of human capabilities, creativity, and emotional depth, leading us to undervalue the essence of being human. AI Versus Human Creativity: A Misleading Comparison The question of AI's creative abilities is as contentious as it is profound. Eryk Salvaggio, a professor in Humanities, Computing and Design, argues that attributing creativity to AI significantly undermines the unique human experiences that define our creative pursuits. According to him, it’s not the machine that creates but humans who make the choice to utilize AI in the creative process. The power of creative thought lies within the person directing the machine, a perspective that re-establishes the value of human creativity in an era increasingly dominated by technology. Understanding Empathy: More Than Simple Simulations Similarly, while AI may demonstrate behaviors that mimic empathy—like analyzing vocal tones or physiological signals—this does not equate to genuine understanding or compassion. Ben Bland, an expert in ethical innovation, points out that AI’s responses are rooted in data-driven pattern recognition rather than authentic emotional comprehension. This distinction becomes critical when we reflect on the environment in which AI operates; it often aims to replace or optimize human interactions, leading to a potential erosion of genuine empathy in spaces where it’s most needed. The Quantification of Human Experience: Risk and Responsibility New insights shed light on how AI transforms our behaviors and actions into data points—this quantification can be both an advantage and a disadvantage. Dr. Christina Colclough explains how the data AI gathers—from our emotional responses to daily decision-making—can shape personal and professional opportunities significantly. While AI analyzes trends and feeds algorithms that purportedly improve experiences, it often lacks the nuanced understanding of context that human interactions rely on. This reliance on data might simplify our complex human experiences, reinforcing how vital it is to retain a human-centered approach to AI implementation. The Language We Use Shapes Our Understanding The language we use around AI holds profound implications for our relationship with these technologies. Words that humanize AI can lead us to overlook the core differences between computation and human emotional experience. By recognizing the impact of language on perception, we can avoid devaluing what it means to be human. As such, it's essential to foster a culture of thoughtful discourse surrounding AI, where language shapes a clearer understanding of technology's role without overshadowing the unique attributes of human beings. Implications for the Future: Bridging the Gap As we navigate an increasingly AI-driven world, our understanding must evolve alongside technological advancements. The challenge lies not merely in the functionality of AI but in how we culturally define and relate to it. Acknowledging the limitations of AI while celebrating human capacity for creativity and empathy is crucial as we strive for a balanced coexistence with these tools. Moving forward, we must cultivate digital literacy that empowers individuals to critically engage with AI technologies—an endeavor that serves to enhance both human potential and technological progress. In this rapidly evolving landscape, individuals interested in understanding the value of AI must keep questioning and redefining these technologies. By embracing an informed approach that recognizes the limitations of AI while elevating the significance of human attributes, we can continue to foster innovation that respects and enhances human experience. Explore your AI learning path today and contribute to a more informed future.

10.10.2025

How Network Analysis in Visual Investigator Revolutionizes Fraud Detection in Auto Insurance

Update Revolutionizing Fraud Detection with Network AnalysisThe landscape of auto insurance fraud is becoming increasingly complex, as fraudulent activities often extend beyond individual claims to intricate networks of colluding parties. In light of this, enterprises are turning towards advanced analytical tools to enhance their fraud mitigation strategies. At the forefront of these innovations is Visual Investigator, a pioneering tool that empowers insurers to unearth hidden relationships among claimants, service providers, and businesses through comprehensive network analysis.Understanding the Core of Network Analysis for Fraud PreventionNetwork Analysis, or link analysis, is a method that utilizes rich datasets to track relationships and interactions among various nodes—such as policyholders, vehicles, and repair shops—belonging to a structured framework. This triple-layered analysis helps organizations visualize connections and audit patterns that are often overlooked when assessing claims in isolation. By enabling investigators to see the bigger picture, it supports the timely identification of suspicious behaviors and relationships that might signify organized fraud.The Metrics that Matter: Quantifying Fraud RisksA potent aspect of tools like Visual Investigator is their ability to quantify these relationships through established metrics, thereby illuminating potential fraud hotspots. Key metrics include:Degree: This metric measures how many connections a node has. A repair shop with numerous connections may warrant further investigation as it could indicate participation in suspicious claims.Betweenness Centrality: This identifies nodes serving as bridges connecting disparate groups. A vehicle or individual that connects otherwise isolated claims could be pivotal in unraveling fraud networks.Connected Components: These refer to the subgroups of nodes interacting closely. Identifying these clusters can highlight groups that might be engaging in coordinated fraudulent acts.Real-World Applications: Visual Representation in ActionTo contextualize these metrics, consider a scenario where a claims analyst employs Visual Investigator during a fraud investigation. Upon receiving a claim, the analyst would visualize it alongside historical data, using combined attributes to reveal anomalies. For instance, if a claim for vehicle damage has multiple shared points with past suspicious claims, the tool can help pinpoint the nexus of activity.Such capabilities not only streamline the analysis process, reducing weeks of investigative work into mere hours, but they also provide actionable insights. This integrated approach might lead to the uncovering of a fraud ring orchestrating scams across multiple claims and connected parties.The Future of Fraud Detection: Insights and OpportunitiesAs the complexity of insurance fraud continues to evolve, adopting sophisticated methodologies like Visual Investigator becomes non-negotiable for insurers. The industry's future surely rests upon harnessing AI and machine learning technologies to refine these analytical tools further.Emerging trends indicate that the integration of predictive analytics within these frameworks will enhance the understanding of potential fraud patterns, allowing firms to act proactively rather than reactively. Such advancements will likely spell a turning point in the battle against organized fraud, especially as technology underpins the sophistication of criminal enterprises.Strategic Implementation for Business ImpactFor businesses eager to implement these advanced technologies into their workflows, several steps are essential. Establishing a dedicated analytics team, investing in continuous training, and leveraging modern data visualization techniques are pivotal to obtaining optimal results. These enhancements not only improve fraud detection but also foster more comprehensive client relationships by ensuring operational efficiency and responsiveness.Wrap Up: Engaging with New Technologies for Sustainable GrowthAs the insurance sector grapples with increasingly sophisticated fraud challenges, the integration of robust network analysis tools like Visual Investigator is imperative for maintaining integrity and competitiveness. The pathways to unlocking this potential are numerous and the benefits, substantial. By fostering a culture of innovation and remaining attuned to technological advancements, insurance companies can position themselves not just to combat fraud, but to propel sustainable growth and trust in an ever-evolving landscape.

Terms of Service

Privacy Policy

Core Modal Title

Sorry, no results found

You Might Find These Articles Interesting

T
Please Check Your Email
We Will Be Following Up Shortly
*
*
*